| Statistics Demystified, 2nd edition |
| Stan Gibilisco |
| Explanations for Quiz Answers in Chapter 8 |
| 1. If we administer the test to a new group of students and obtain a distribution in which the span between µ - σ and µ + σ exceeds the span between µ - σ and µ + σ in the first distribution, we'll find that the data appears more "spread-out" with a larger value of σ (the standard deviation). The answer is B. |
| 2. If the professor replaces one question in the 10-question quiz and then has the students work out the new problem in place of the old one, the distribution will almost certainly change slightly. (The distribution would remain the same only if the new question produced the same combination of right-and-wrong answers as the original question did.) However, without specific data for the students' answers to the new question, we can't know exactly what would happen to the shape of the plot. The correct choice is D. |
|
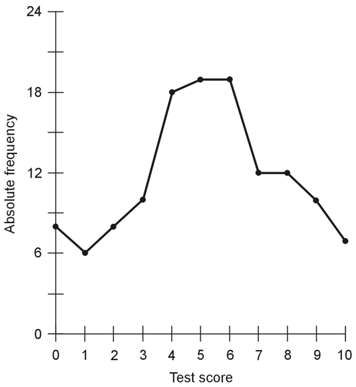
3. In order to work out this problem, we must generate the new distribution, producing a new graph after the fashion of Fig. 8-6 (on page 273). When we do that, we get the following plot.
When we visually compare this graph with Fig. 8-6 in the book, we see that this plot appears more "flattened-out" (that is, less sharply peaked) than Fig. 8-6. The correct choice is C. |
| 4. Table 8-10 (on page 304) makes perfect sense. No technical problem exists in it. The answer is D. |
| 5. If we toss a 12-faced, unbiased die five times and it comes up showing face number 1 on all five occasions, we've experienced a result whose probability equals 1 in 125, or 1 in 248,832. The correct choice is B. |
| 6. This experiment reveals the fact that skin problems correlate positively with adult-onset diabetes (AOD). The results tell us nothing, however, about any possible cause/effect relation between skin problems and AOD, or between either of those manifestations and some third factor, known or unknown. The correct choice is D. |
| 7. The points in the scatter plot of Fig. 8-18 (on page 305) look "random," in the sense that they don't appear to fall near any particular line or curve. No evident correlation exists between the percentage of land area covered by forest and the percentage of people who suffer from Syndrome X. The correct choice is A. We can rule out choices B and C straightaway for the foregoing reason. Choice D has no relevance. If no correlation exists, then no cause/effect relation can exist either. Even if a correlation were found, that fact, all by itself, wouldn't imply that a causative agent had anything to do with it. |
| 8. If we engage a computer in an attempt to find a least-squares line in the plot of Fig. 8-18, then in effect, we're asking the machine to quantify something that doesn't exist, like trying to work out the quotient 0/0. We'll likely see no result, or else an "error" message. The answer is D. (If our least-squares-line-calculating software is poorly written, we might get to watch our computer crash.) |
| 9. The graph of a normal distribution always appears symmetrical relative to the mean. Choice C is false. All of the other statements hold generally true. Therefore, C constitutes the right answer here. |
| 10. In this particular town, a strong positive correlation exists between average monthly temperature and average monthly precipitation. As one parameter increases, the other one always increases. As one parameter decreases, so does the other. The correct choice is A. |